
Table of Contents
Bittensor's 128+ active subnets collectively distributed $97.6M worth of TAO to miners and validators over the past 30 days, while generating $26M in revenue from actual paying users. That $71M gap is carried by TAO holders, and most people staking into subnet Alpha tokens have no idea how to measure it.
Two community-built tools close that information gap. TaoRevenue.com tells you whether a subnet's economics are real or subsidy-dependent, using verifiable on-chain revenue data. TaoFlute.com tells you how the Alpha token is trading, whether the team behind the subnet is actively shipping code, and what it would cost you to exit a position today. Used together, they answer the questions that price charts and team announcements don't.
The Foundation: How Bittensor's Economics Work
Bittensor is a decentralized AI marketplace where independent sub-networks, called subnets, compete for newly minted TAO tokens by producing useful AI outputs.
Each subnet is built around a specific task: text inference, image generation, financial signals, compute brokerage, and dozens more. Miners perform the AI work, validators score the quality of that work, and both earn a share of daily emissions based on their performance.
TAO is Bittensor's base currency, hard-capped at 21 million tokens, like Bitcoin, and it serves as the settlement layer across every subnet on the network. Since the dTAO upgrade in February 2025, every subnet also has its own Alpha token, backed by a TAO/Alpha liquidity pool managed by an Automated Market Maker, or AMM, which is the on-chain pricing engine that sets the Alpha token price based on the ratio of TAO to Alpha held in reserve. When you stake TAO into a subnet, you're purchasing that subnet's Alpha token, and the Alpha price reflects what the market currently believes the subnet is worth.
Emissions are the daily flow of newly minted TAO distributed across subnets, cut to 3,600 TAO per day after the December 2025 halving, and split roughly 41% to miners, 41% to validators, and 18% to subnet owners. The November 2025 Taoflow upgrade changed how those emissions are allocated: instead of distributing based on token price, Bittensor now distributes based on net TAO staking flows, meaning subnets attracting more new stakers than they're losing earn a larger share of daily emissions, and subnets bleeding stakers earn progressively less. That flow mechanic is the economic engine both dashboards measure.
TaoRevenue: Which Subnets Are Earning Their Keep
TaoRevenue.com, built by Tao Portal, reduces every subnet to a single verdict by asking whether it generates enough external economic activity to justify the TAO it consumes from the network.
When you open the site, the first two numbers you see are Total Bittensor Inflow and Total Bittensor Outflow for your selected time window. Inflow is real external revenue flowing into subnets from paying users of AI services, meaning actual customers paying for the subnet's output, and over the past 30 days that figure sits at 82,685τ ($24M) across the entire network.
Outflow is TAO flowing out of subnets to miners and validators as emission payments, a figure that every subnet accumulates automatically regardless of whether it generates any external revenue, and over the same 30-day window that number is 311,459τ ($93M). The gap between those two headline figures is the single most important number on the site: it tells you how much TAO holders are currently subsidizing the ecosystem.
In the top-right corner, toggle between the 24H, 7D, and 30D time windows. The 30-day window smooths out daily noise and gives you the most reliable signal for evaluating sustainability. The 24-hour window is useful for catching recent events, like a partnership announcement or a sudden spike in user activity, that haven't yet shown up in the longer trend.
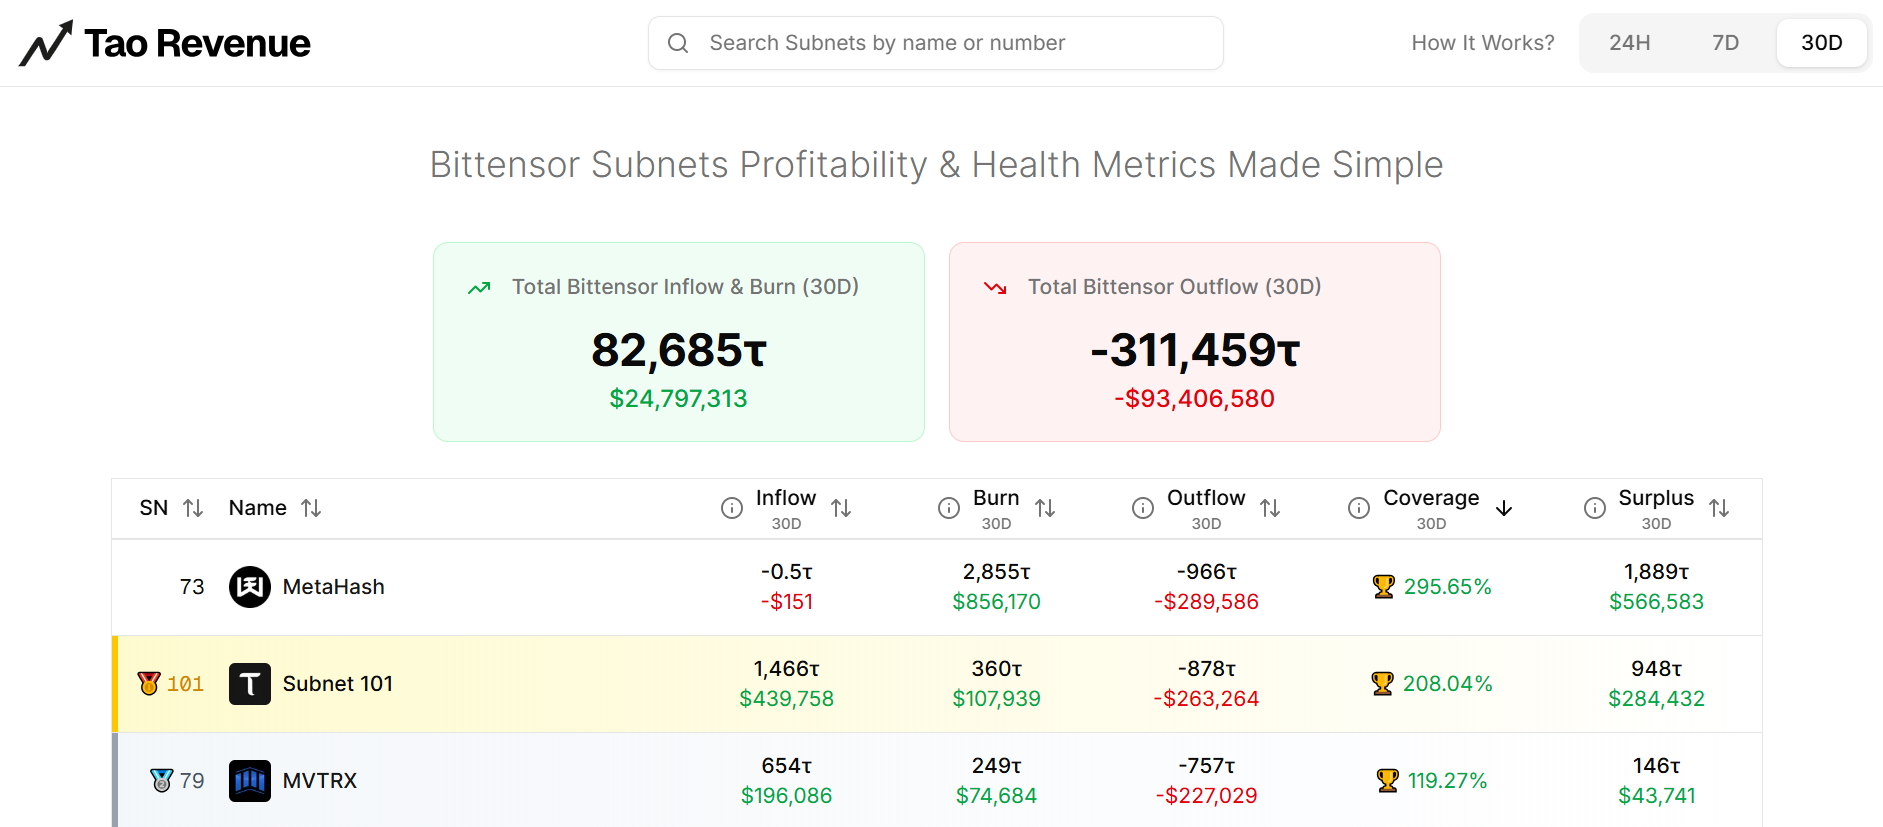
The main table lists every subnet sorted by Coverage % by default, and Coverage is the metric that matters most on this site. Coverage is calculated as Inflow plus Burn, divided by Outflow, multiplied by 100, which tells you what percentage of a subnet's operating cost is covered by real economic demand rather than emission subsidies. A Coverage reading above 100% means the subnet generates more value than it consumes, and a reading below 50% means the subnet covers less than half its costs from real demand and depends on emission subsidies to survive.
Each column in the main table carries a specific meaning:
- SN is the subnet's unique on-chain identifier, with lower numbers corresponding to older, more established subnets and numbers above 100 indicating recently launched projects.
- Inflow is demand-side revenue: real payments from users or API customers for the subnet's AI services. Only around 15 subnets showed positive inflow in the most recent 30-day window, indicating that the vast majority of Bittensor subnets currently generate no measurable external revenue.
- Burn is TAO permanently destroyed through miner registration fees. When a miner wants to join a competitive subnet, they pay to register, and the TAO they used is permanently removed from circulation. High burn signals that miners believe the subnet will pay them back more than their registration cost, making it a forward-looking demand signal. Templar (SN3) burned 5,516τ ($1,654K) in 30 days, and Hippius (SN75) burned 2,965τ ($889K), both indicating intense miner competition for slots on those subnets.
- Outflow is the TAO paid out to miners and validators as emissions. Every subnet has outflows automatically because emissions are distributed regardless of performance, and outflow represents the cost structure of running a subnet on the Bittensor network.
- Surplus is Inflow plus Burn minus Outflow, expressed in both TAO and USD. A positive surplus means the subnet created more economic value than it consumed, and a negative surplus means the network subsidized its existence. Of 128+ active subnets, only three showed positive surplus over the most recent 30-day window: SN101 at a surplus of 940τ ($297K) with 205.51% coverage, MVTRX (SN79) at 108.49% coverage with a 65τ surplus, and MetaHash (SN73) at 289.02% coverage driven almost entirely by miner burn rather than user-facing revenue.
Chutes (SN64) is the most instructive case on the board. It processes more than 5 million daily inference requests and carries the highest outflow on the network at 19,723τ ($5.9M) over 30 days, against a coverage reading of just 12.84%, which means TAO holders are subsidizing roughly $5.1M of Chutes' monthly operating cost. Chutes prices AI inference below cost to acquire users and build market share, a coherent growth strategy if the team converts those 5 million daily requests into paying revenue before the next halving tightens that subsidy further.
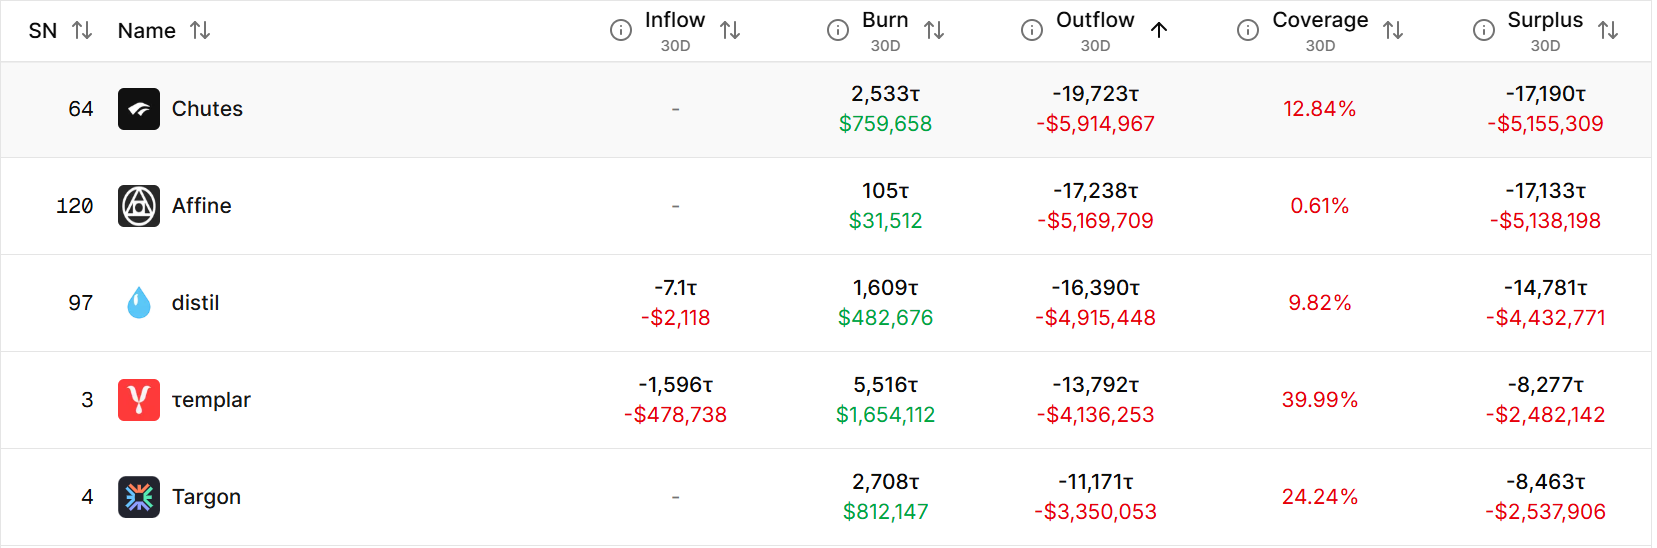
Negative inflow values carry their own signal and deserve attention. Templar (SN3), home of the Covenant-72B model, shows -1,596τ ($478K) in 30-day inflow, meaning more TAO left SN3 than entered during the window. Negative inflow is a capital-flight signal: under the Taoflow model, sustained net outflows translate directly into lower emissions over time, creating a compounding pressure on the subnet's ability to pay its miners and validators.
TaoFlute: Price, Development Activity, and the Exit You Haven't Priced In
TaoFlute.com tracks three dimensions of subnet health that no other Bittensor dashboard combines: how the Alpha token is trading, whether the development team is actively shipping code, and the real cost of exiting a position through the liquidity pool. Most token trackers show you the first dimension, and TaoFlute shows you all three, with the third being the one that changes how you read the other two.
The Flags and Links column on the far left shows a row of icons for each subnet, including links to the project's website, GitHub repository, X account, and Discord server, along with visual indicators for whether the subnet has active miners, active validators, and liquidity enabled. These icons are a fast way to verify whether a subnet has a real public presence before spending time on its metrics.
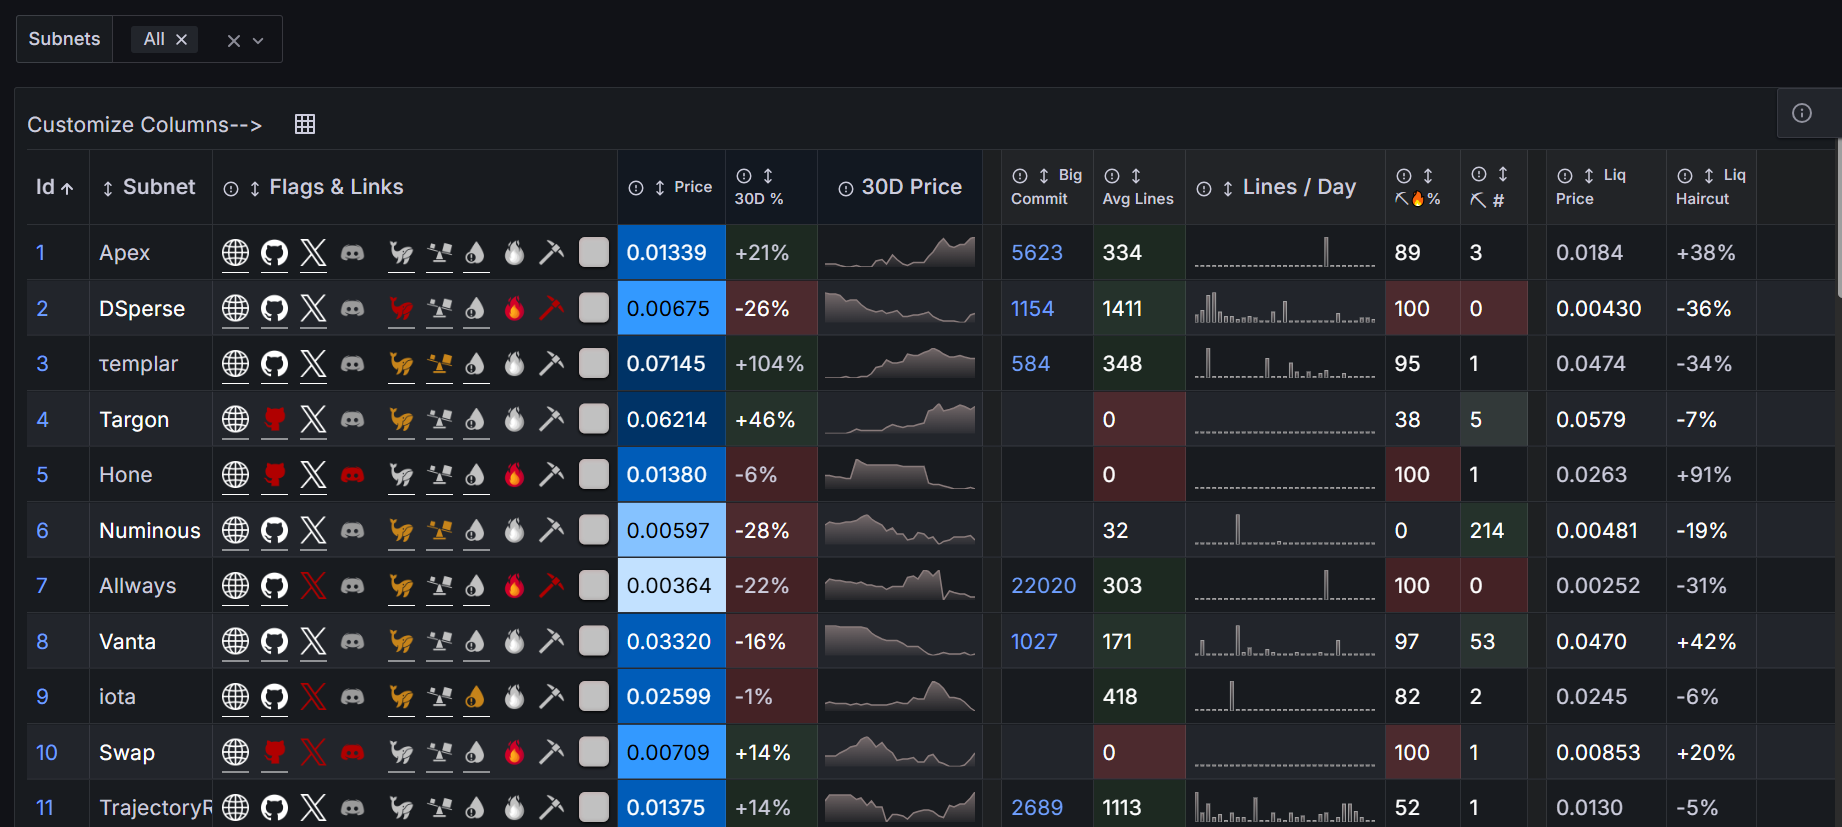
The price columns are straightforward. Price is the current Alpha token value denominated in TAO, not in USD, so a price of 0.02113τ for NOVA (SN68) means one NOVA Alpha token costs 0.02113 TAO at the current market rate. The 30D% column shows how that price has changed over the past 30 days, with SOMA (SN114) up 73% and Harnyx (SN67) down 99% over the same period. The 30D Price column renders as a sparkline chart showing the shape of that price movement, letting you distinguish a steady climb from a spike-and-crash or a slow bleed.
The development columns pull live data from each subnet's GitHub repository, and they answer a question that price data alone cannot: is the team that built this subnet still building it?
Big Commit shows the size of the largest single code push to the subnet's repository, measured in lines of code. Djinn (SN103) logged a Big Commit of 255,245 lines, which signals a major architectural change or a large data push rather than routine maintenance. A very small Big Commit value, or no value at all, suggests the repository has seen little meaningful activity.
Avg Lines shows the average number of lines of code changed per commit across recent activity. NOVA (SN68) averages 1 line per commit, indicating a team making many tiny incremental changes, which often reflects active iteration on a live product. Harnyx (SN67) averages 1,050 lines per commit, indicating fewer but heavier code pushes, which often reflects a team doing larger structural work in concentrated bursts.
Lines/Day renders as a bar chart showing daily commit volume over time. Consistent bar height across the chart means the team is shipping on a regular cadence, tall bars followed by long gaps mean development activity is sporadic, and no bars at all means the repository has gone quiet.
These three development metrics are forward-looking in a way that TaoRevenue's revenue data isn't, because a subnet with low current Coverage but an active Lines/Day chart and a recent large commit represents a different risk profile from one with low Coverage and no GitHub activity in months.
The liquidity columns are where TaoFlute's analytical edge is sharpest, and where most new users stop reading before extracting the most useful information.
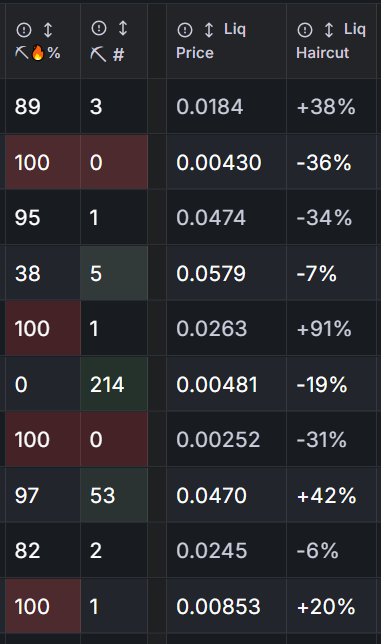
Liq 🔥% shows the percentage of the subnet's Alpha liquidity pool that has been committed or burned into the pool. Values at 100%, which appear across several subnets including SOMA (SN114) and ORO (SN15), indicate maximum liquidity concentration has been reached in that pool.
Liq # is the number of active liquidity positions in the subnet's pool. Djinn (SN103) carries 246 active positions while NOVA (SN68) carries just 2, and the difference matters: 246 positions spread across many participants means the liquidity is distributed and less vulnerable to a single large withdrawal, while 2 positions means a single holder exiting could move the pool dramatically.
Liq Price is the Alpha token price as implied by the on-chain AMM reserve ratio, which is the price the liquidity pool itself calculates based on how much TAO and how much Alpha it holds in reserve. This price often diverges from the market price in the Price column, because the market price reflects recent trade activity while the AMM price reflects the underlying pool composition.
Liq Haircut is the percentage gap between the Liq Price and the market price, and it's the single most important liquidity metric on the site. A -57% haircut on Djinn means the pool price is 57% below the market price, so attempting to exit a meaningful Djinn position through the liquidity pool would cost you 57% of the market value. A -98% haircut on Harnyx means you'd take a near-total loss exiting through the pool, while a haircut close to 0%, or positive like BrainPlay (SN117) at +1% or Sparket.AI (SN57) at +7%, means the pool price and market price are closely aligned, and exit risk is low.
Reading TaoRevenue and TaoFlute Together
These two tools produce their most useful analysis when run in sequence on the same subnet, because they answer different questions that together form a complete picture.
Start every evaluation on TaoRevenue by checking Coverage over 30 days. Subnets above 80% are at least partially self-sustaining and generate enough real demand to cover most of their operating costs. Subnets at 10–20% depend almost entirely on continued emission subsidies and would struggle to retain miners if those subsidies thinned. Once you have the Coverage reading, move to TaoFlute and check the Liq Haircut alongside it, because a subnet with strong Coverage but a -90% haircut is generating real revenue while simultaneously trapping anyone holding its Alpha token.
Harnyx (SN67) is the hardest case on the board right now. Its price is down 99% over 30 days, its Liq Haircut sits at -98%, and its Avg Lines sits at 1,050 per commit, which means the development team is still shipping substantial code into a collapsing token with near-zero liquidity. TaoRevenue would tell you whether any paying revenue justifies holding the remaining position. Without reading both tools in sequence, you'd either dismiss Harnyx entirely based on price or overweight the development signal without accounting for what the liquidity data reveals about the exit cost.
The Two Questions Every Subnet Has to Answer
TaoRevenue asks whether a subnet would survive if emissions went to zero tomorrow. Of 128+ active subnets, only three answered yes over the most recent 30-day window, while the other 125-plus exist on TAO holder subsidies. TaoFlute asks what it would cost you to exit today if you discovered the answer was no.
The second halving triggers when total TAO supply reaches 15,750,000 TAO, which, at 3,600 TAO emitted per day, projects to approximately 2029. When emissions drop from 3,600 to 1,800 TAO per day, the outflow side of the network's economics falls by roughly half in TAO terms. At current prices, that compresses the monthly gap between outflow and inflow from $71M toward approximately $23M, assuming user revenue holds steady, because the $26M in inflow stays constant while outflow drops from $97.6M to around $48.8M.
The subnets showing up in TaoRevenue's Inflow column before that date are building something durable. The ones carrying manageable Liq Haircuts on TaoFlute are the ones you can exit if you're wrong.
Both tools are live, both are free, and both require nothing beyond a browser tab. You now have the economic picture and the exit map.
Disclaimer: This article is for informational purposes only and does not constitute financial, investment, or trading advice. The information provided should not be interpreted as an endorsement of any digital asset, security, or investment strategy. Readers should conduct their own research and consult with a licensed financial professional before making any investment decisions. The publisher and its contributors are not responsible for any losses that may arise from reliance on the information presented.


